Development
Data Cleaning with Python Pandas

Machine learning and deep learning projects are gaining more importance for a lot of organizations. The complete process includes data preparation, building an analytic model and deploying it to production.
There are various techniques to prepare data, including extract-transform-load (ETL) batch processing, streaming ingestion and data wrangling, etc. But how can you sort it all out?
In this article, we will be diving into data cleaning and how to work with data using Python Pandas.
At the end of this guide, we will get into a how-to demonstrating data cleaning with Pandas step by step in a real world ETL project.
Want to access the final source code of what we will be creating ! can be found.

A brief overview
What is Data Cleaning?
Data cleaning is the process of preparing data for analysis by removing or fixing data that is incorrect, incomplete, irrelevant, or duplicated within a dataset. It’s one of the important stages of machine learning. It plays a significant part in building a model.
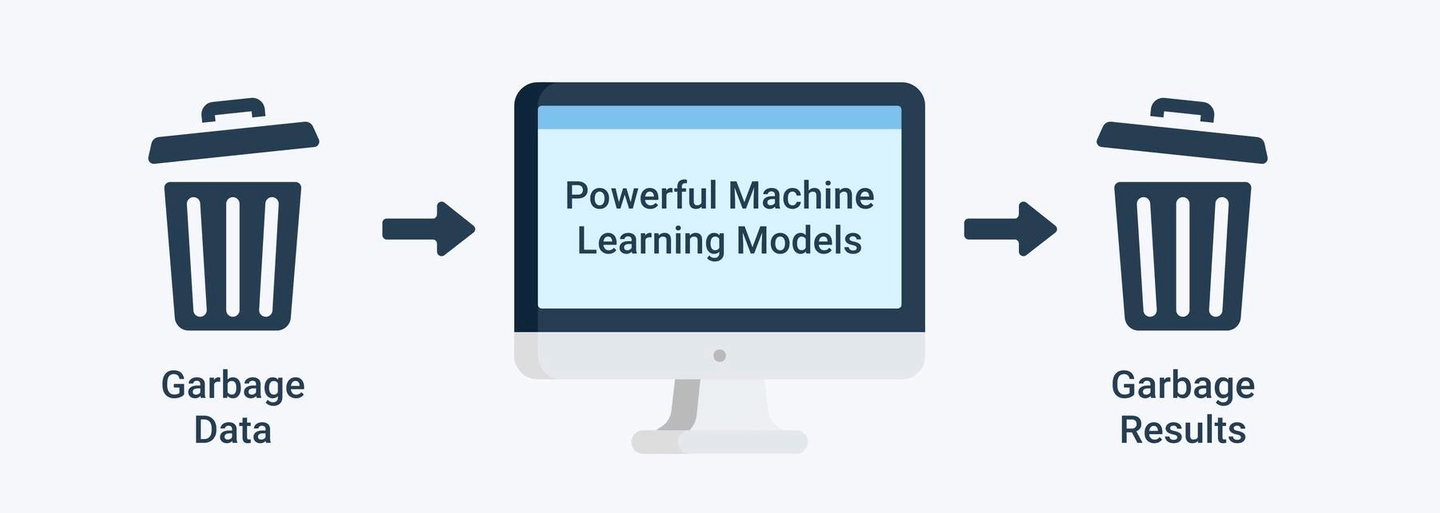
Why does it matter? Feeding bad data in any system is a no go. Poor data quality leads to poor results: “Garbage In, Garbage Out”.
Data cleaning can seem as a tedious task, but it’s a fundamental block for any data analytics problem solving. Good and clean data can be used to produce accurate and trustworthy insights. Data scientists/engineers spend 60-80% of their time carrying out data cleaning activities.
How to clean data?
Data cleaning puts data into the right shape and quality for analysis. It includes many different steps, for example:
- Basics (select, filter, removal of duplicates, …)
- Sampling (balanced, stratified, …)
- Data Partitioning (create training + validation + test data set, …)
- Transformations (normalization, standardization, scaling, pivoting, …)
- Binning (count-based, handling of missing values as its own group, …)
- Data Replacement (cutting, splitting, merging, …)
- Weighting and Selection (attribute weighting, automatic optimization, …)
- Attribute Generation (ID generation, …)
- Imputation (replacement of missing observations by using statistical algorithms)
Now that we are on the same page of what data cleaning is and its importance, we’ll explore some practical aspects of effective data cleaning using Pandas!
Data cleaning with Pandas
What is Pandas?
- Pandas is a Python library that gives you a set of tools to do data processing.
- It has great performance as it’s built on top of Numpy, which is written in C, so it executes quickly.
- What can we do with data using Pandas? With Pandas, we can perform data filling, data normalization, merges and joins, statistical analysis and much more…
How to?
Let’s take a look at some Pandas commands that will be used frequently:
(Notebook for the following content)
1. Create a DataFrame
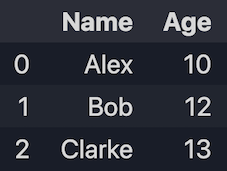
1.1 Create from lists
import pandas as pd
data = [['Alex', 10], ['Bob', 12], ['Clarke', 13]]
df = pd.DataFrame(data, columns=['Name', 'Age'])
print(df)
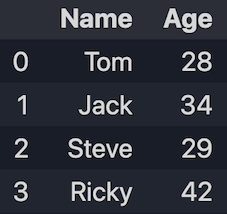
1.2 Create from dicts
data = {'Name': ['Tom', 'Jack', 'Steve', 'Ricky'], 'Age':[28, 34, 29, 42]}
df = pd.DataFrame(data)
print(df)
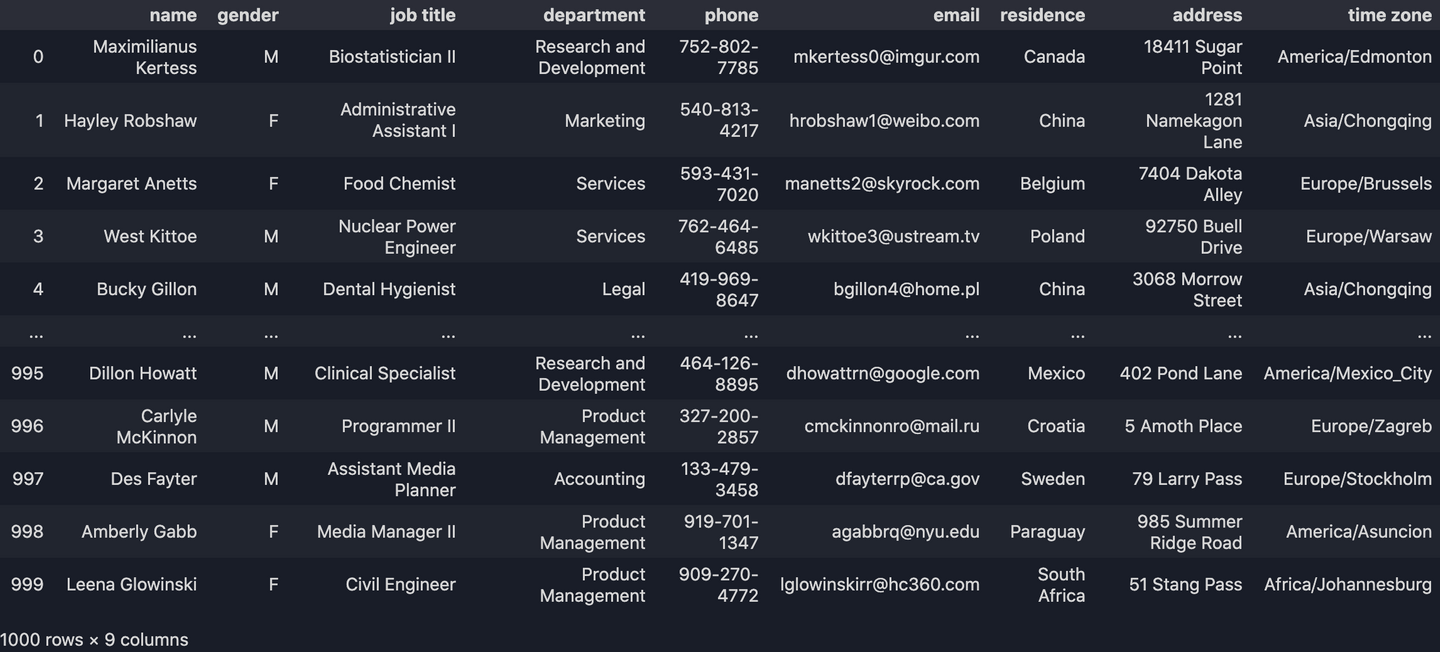
2. Import Dataset
(The following examples will be using this dataset)
df = pd.read_csv("data.csv")
print(df)
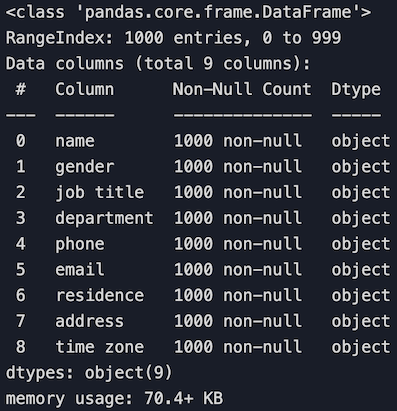
3. Get a general information of the dataset
df.info()
4. Row/Column Selection
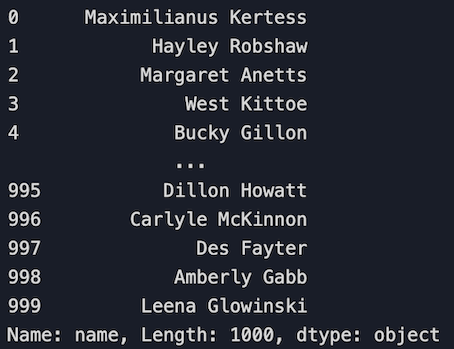
4.1 Select a column
# Select the 'name' column
df['name']
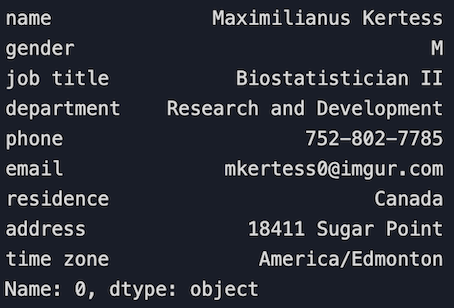
4.2 Select a row
# Select the first row
df.loc[0]
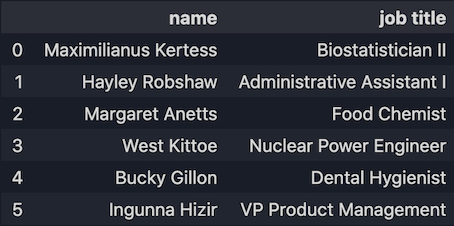
4.3 Select multiple rows and columns using loc[]. It can take in two inputs:
loc[<rows_to_select>,<columns_to_select>]
Get the records with row index 0 to 5 and with columns 'name' and 'job title'.
df.loc[0:5,["name","job title"]]
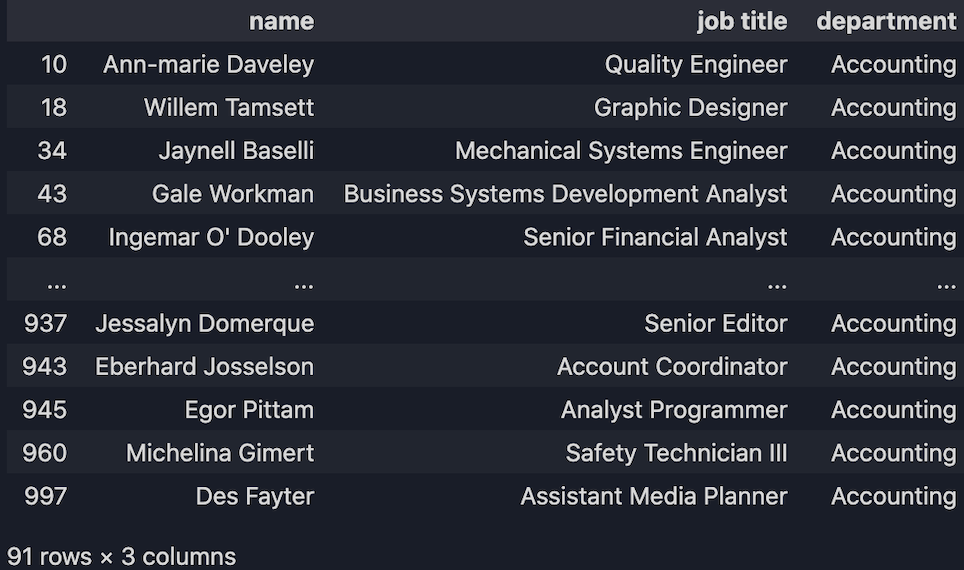
Get records based on conditions. For example, we want to get all the employees that work at the Accounting department:
df.loc[(df["department"] == "Accounting"), ["name", "job title", "department"]]
And more…
# Delete a column
del df['column_name']
df.drop('column_name', axis=1)
pop('column_name')

# Drop duplicates
df.drop_duplicates()

# Data filling
df['column_name'].fillna('some_values')

# Sorting
df.sort_values(by='column_name')

# Merge
df.merge(data_2, on='column_name', how='left')

# Query
df['column_name'].where(df['column_name'] > 50)

# Check data types
df.dtypes
df.dtypes['column_name']
Check out the documentation for more functions/commands.
Use Case - An ETL pipeline
Now let’s take a look at a real world data cleaning example - An ETL data pipeline.
What is ETL?
ETL stands for Extract, Transform and Load. It’s a process for moving data from one system to another for storage and further handling.
Project Description
There is a smart phone manufacturer with hundreds of different machines producing those phones every day.
To review productivity and waste more efficiently, we want to get the real time manufacturing status and information from each production line in the plants and display that information on a real-time dashboard with analytics, statistics and graphics at the end.
A simple workflow for the process would look like: Machines ⮕ Log data ⮕ Data Storage ⮕ API service ⮕ UI Dashboard
Here’s how
What this ETL will be doing is to extract the manufacturing records that consist of a bunch of observations, which is the log data from those machines. By monitoring those observations, we can catch any errors and outliers right away and send it to an alarm system. However, logs are NOT clean. Now we will do some processing with the logs to make sure at the end we have clean data that will go to a machine model or a data storage for further analysis.
Our task
We will take the log file as our INPUT to process. As for the OUTPUT, we will have the clean data exported to a CSV. (A real ETL process writes the clean data to a data storage at the end, we won’t carry out that part here, we will only focus on handling the raw data itself.)
Input
The dataset we will be using is a log file that is extracted from a real CNC machine.
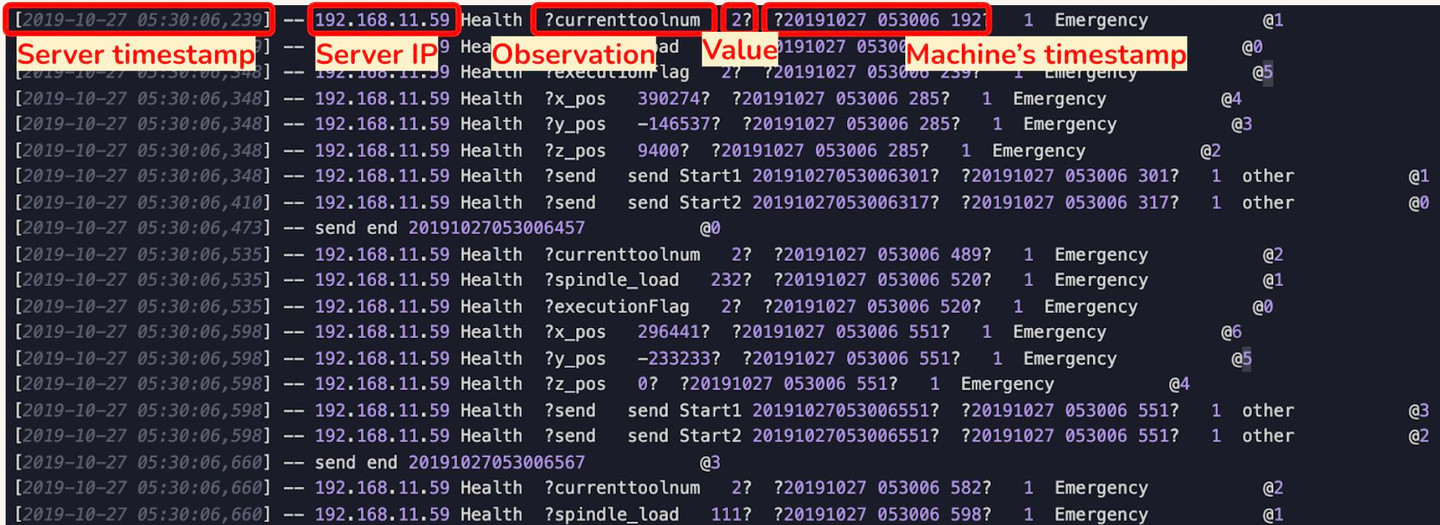
What’s in this log file?
Let’s take a look at the first row, from left to right we have the Server's timestamp, Server IP Address, some Observations and its Values and the CNC Machine's timestamp.
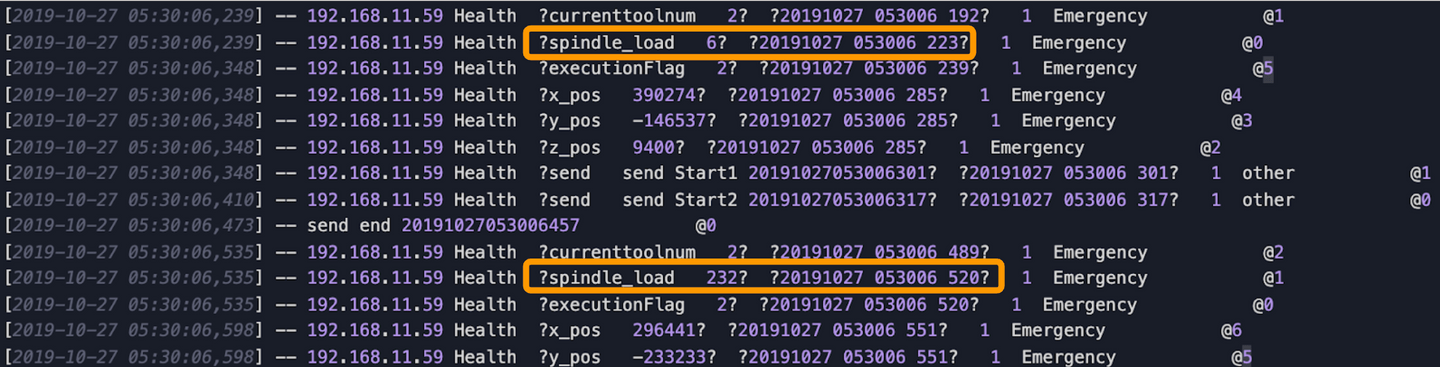
Our GOAL is to “extract the data we need”. In this case we will only take 3 things (which in yellow circled below):
- All observations
- The values of the observations
- CNC Machine’s timestamp
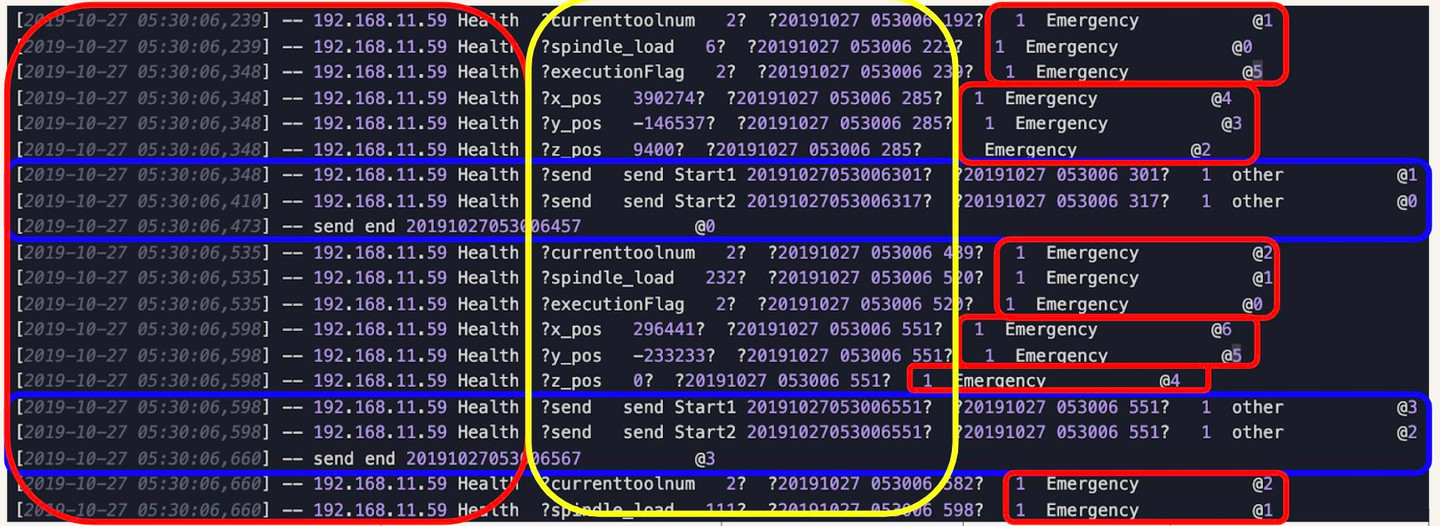
The rest (red and blue circled) we will drop them. (We drop the rows that do not have observations, which are circled in blue)
⮕ Drop unwanted data is one of the most common tasks for data cleaning.
Output
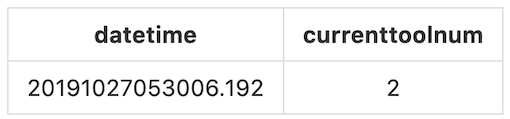
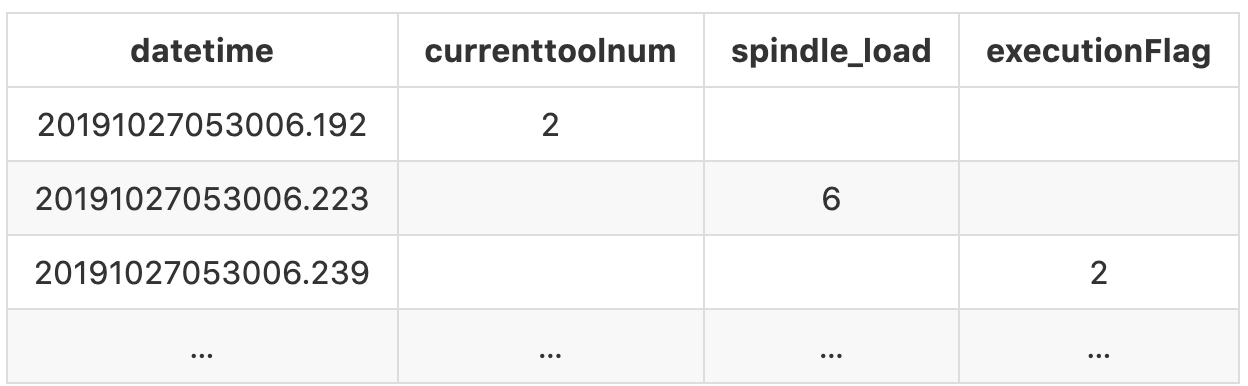
To generate the desired output, we will take the machine's timestamp as our row index, the observations as our column names, and the values will be the row data. For example, the first observation we have is currenttoolnum with the value 2, the generated timestamp is 20191027053006.192:
[2019-10-27 05:30:06,239] -- 192.168.11.59 Health ?currenttoolnum 2? ?20191027 053006 192? 1 Emergency @1
Hence our output for the first record will be:
If we follow that convention for the rest of the records, at the end the output should be look like:
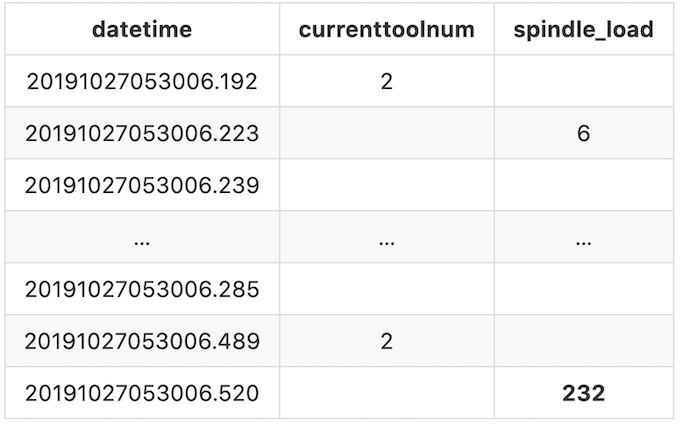
There’s one more thing we need to do. In this log file, there are some observations may appear multiple times and sometimes the value varies.
For example, the first spindle_load (The second record in the log file) we get is at 20191027053006.223 with the value 6, the next time we get is at 20191027053006.520 with the value 232. This means during this period of time, the value for spindle_load is 6 and it will remain 6 till the next valid value we get. In this case, spindle_load is 6 between 20191027053006.223 and 20191027053006.520, and it turns to 232 starting from 20191027053006.520.
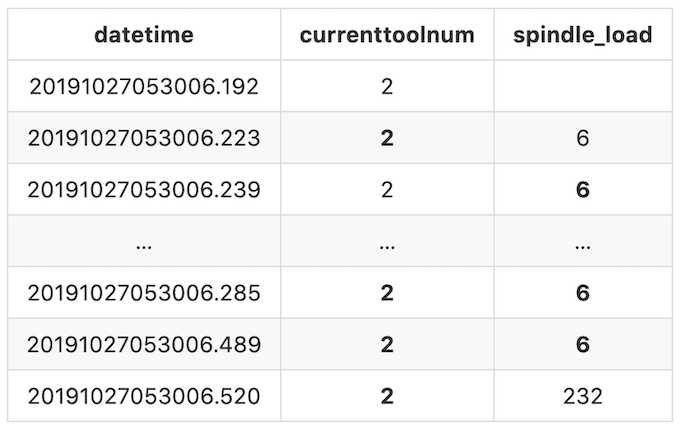
To display that clearly, we will populate the missing values with the previous valid value forward till the next different value appears. After filling up the missing values, our final output would look like:
Now we’re clear with the dataset and our goals, let’s start cleaning the data!
1. Import the dataset
import pandas as pd
# Import the dataset into Pandas dataframe
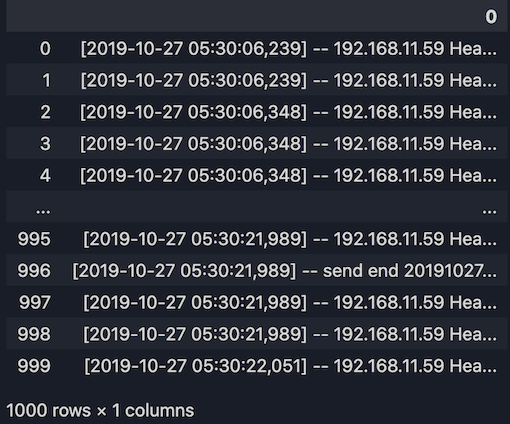
raw_dataset = pd.read_table("test_data.log", header = None)
print(raw_dataset)
2. Convert the dataset into a list
dataset_list = list(raw_dataset[0])
print(dataset_list)
Out:
['[2019-10-27 05:30:06,239] -- 192.168.11.59 Health  ?currenttoolnum   2?  ?20191027 053006 192?   1  Emergency           @1',
'[2019-10-27 05:30:06,239] -- 192.168.11.59 Health  ?spindle_load   6?  ?20191027 053006 223?   1  Emergency           @0',
'[2019-10-27 05:30:06,348] -- 192.168.11.59 Health  ?executionFlag   2?  ?20191027 053006 239?   1  Emergency           @5',
...]
3. Split the line by space
# [:14]--> We only need the first 14 columns of the dataset.
line_split = [line.split(' ')[:14] for line in dataset_list]
long_df = pd.DataFrame(line_split)
print(long_df)
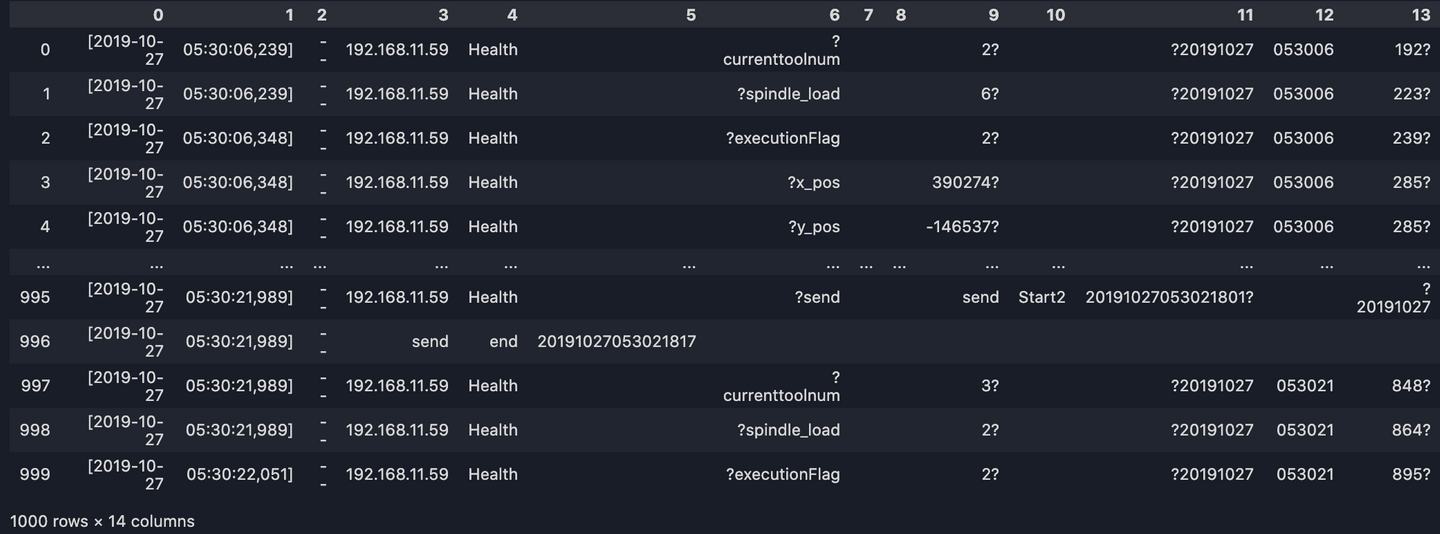
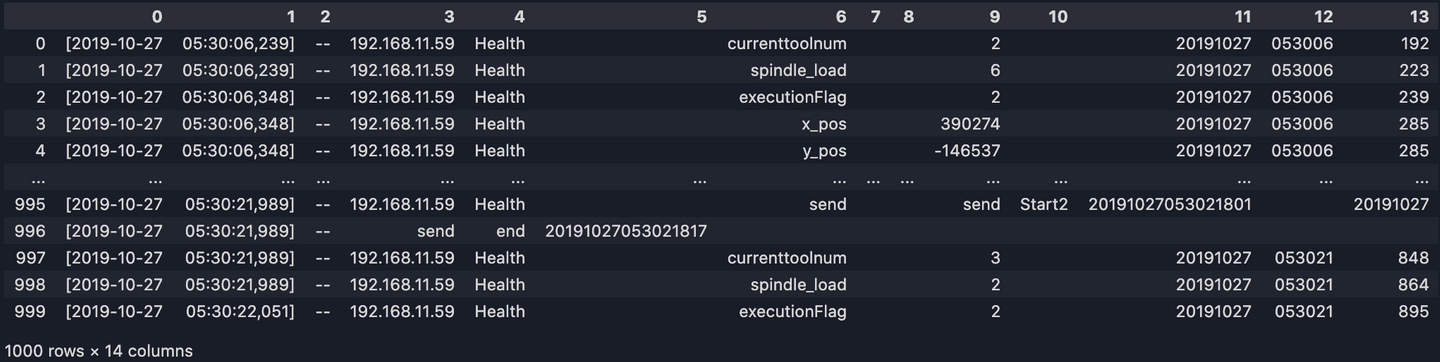
4. Remove the question marks
Some annoying question marks appear in column 6, 9, 11 and 13. To remove them:
long_df[6] = list(map(lambda s: s.replace('?', ''), long_df[6]))
long_df[9] = list(map(lambda s: s.replace('?', ''), long_df[9]))
long_df[11] = list(map(lambda s: s.replace('?', ''), long_df[11]))
long_df[13] = list(map(lambda s: s.replace('?', ''), long_df[13]))
print(long_df)
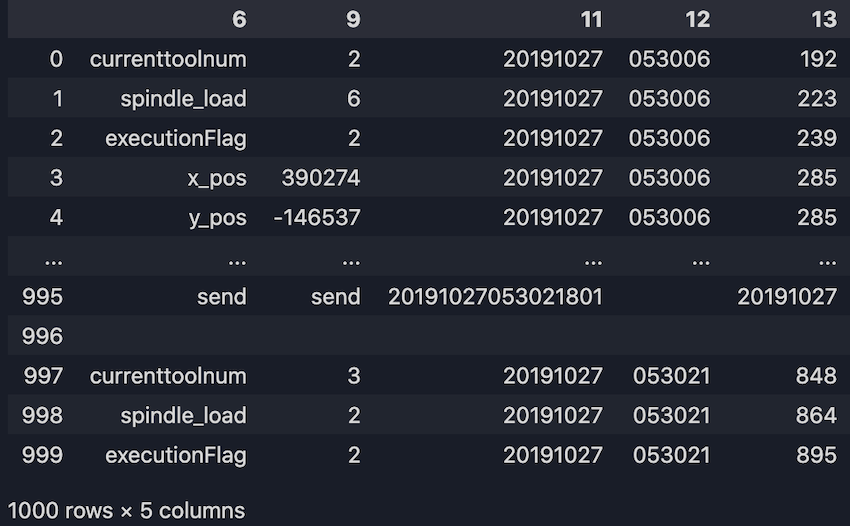
5. Get the columns we need
Here we only take observations, values and machine's timestamp:
long_df = long_df.loc[:, [6, 9, 11, 12, 13]]
print(long_df)
6. Take all the arguments from the column "6" as our dataframe columns
We will turn all the observations into our column names:
all_columns = list(set(long_df[6].tolist()))

# Remove the data we don't need
all_columns.remove('')
all_columns.remove('send')

# Sorting the list
all_columns.sort()
print(all_columns)
Out:
['F_actual', 'OPmode', 'OPstate', 'RPM_actual', 'currenttoolnum', 'cuttingTime', 'cycletime', 'executionFlag', 'feedF', 'feedratio', 'inspectionData', 'line_name', 'machine_num', 'operatingTime', 'poweronTime', 'shop_name', 'spindle_load', 'spindle_temp', 'spindleratio', 'tool_current_life_01', 'tool_current_life_02', 'tool_current_life_03', 'tool_current_life_04', 'tool_current_life_05', 'tool_current_life_11', 'tool_current_life_12', 'tool_current_life_13', 'tool_current_life_14', 'tool_current_life_15', 'tool_preset_life_01', 'tool_preset_life_02', 'tool_preset_life_03', 'tool_preset_life_04', 'tool_preset_life_05', 'tool_preset_life_11', 'tool_preset_life_12', 'tool_preset_life_13', 'tool_preset_life_14', 'tool_preset_life_15', 'workcount', 'x_pos', 'y_pos', 'z_pos']
7. Reshape the long_df from long to wide format and take the timestamp as row index
column_count = len(all_columns)
pre_time = ''
record = []
records_list = []
for line in dataset_list:
str_list = line.split(' ')
if str_list[6] != '' and str_list[6][0] == '?' and str_list[11][0] == '?':
request = str_list[6][1:]
if request in all_columns:
date = str_list[11][1:5] + str_list[11][5:7] + str_list[11][7:]
time = str_list[12][0:2] + str_list[12][2:4] + str_list[12][4:]
millisec = str_list[13][:-1]
cur_time = date + time + '.' + millisec
response = str_list[9].replace('?', '')
if cur_time != pre_time:
if record != []:
records_list.append(record)
record = [cur_time] + ['' for i in range(column_count)]
pre_time = cur_time
record[all_columns.index(request) + 1] = response
records_list.append(record)
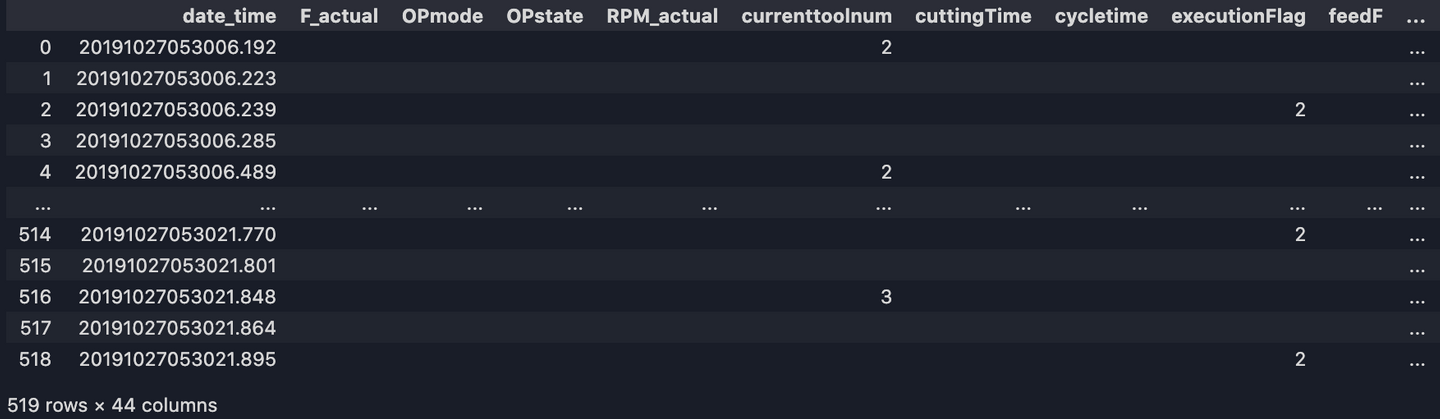
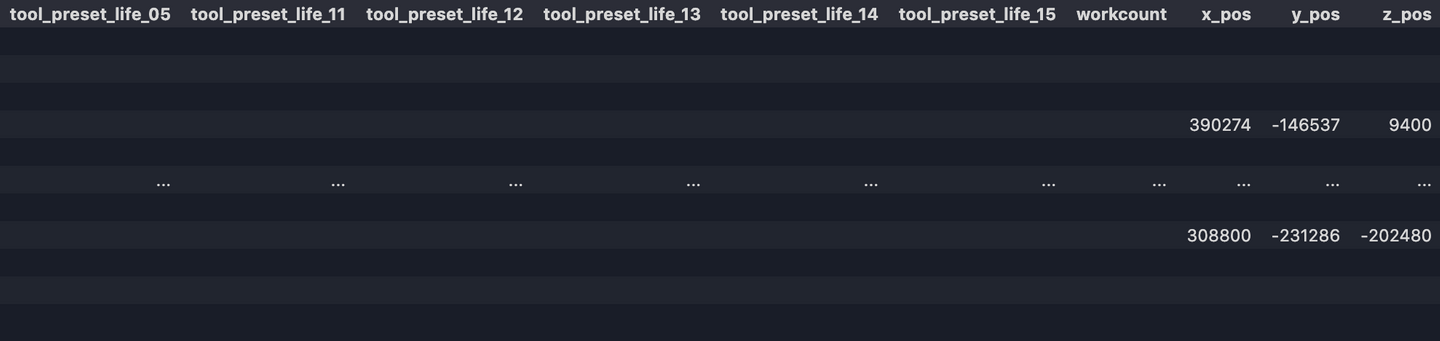
df = pd.DataFrame(records_list, columns=['date_time'] + all_columns)
print(df)
Now our dataset should look like:
8. Convert datatypes, reset index, replace empty values NAN
# Convert argument to a numeric type. (The default return dtype is float64 or int64 depending on the data supplied)
df[all_columns] = df[all_columns].apply(pd.to_numeric, errors='ignore')
# Reset index (optional)
df = df.reset_index(drop=True)
# Replace empty values with Pandas NAN
df = df.replace('', np.nan)
# Export to CSV
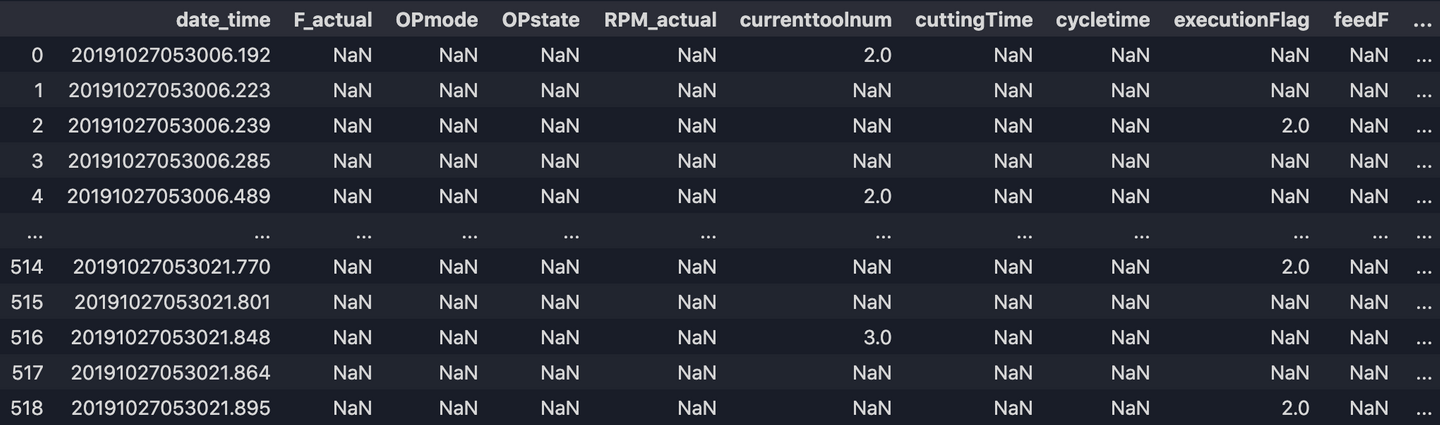
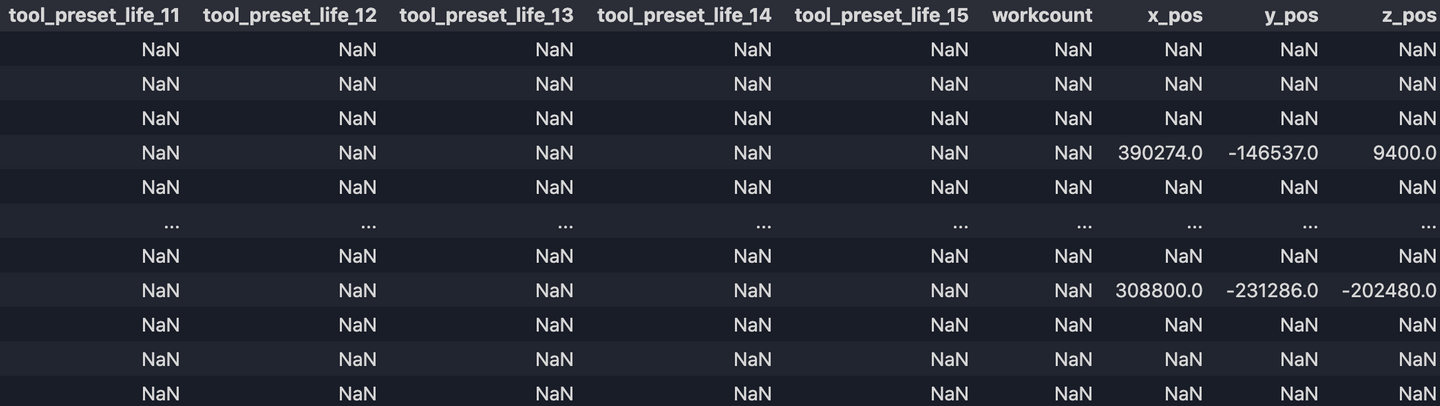
df.to_csv('output/df.csv')
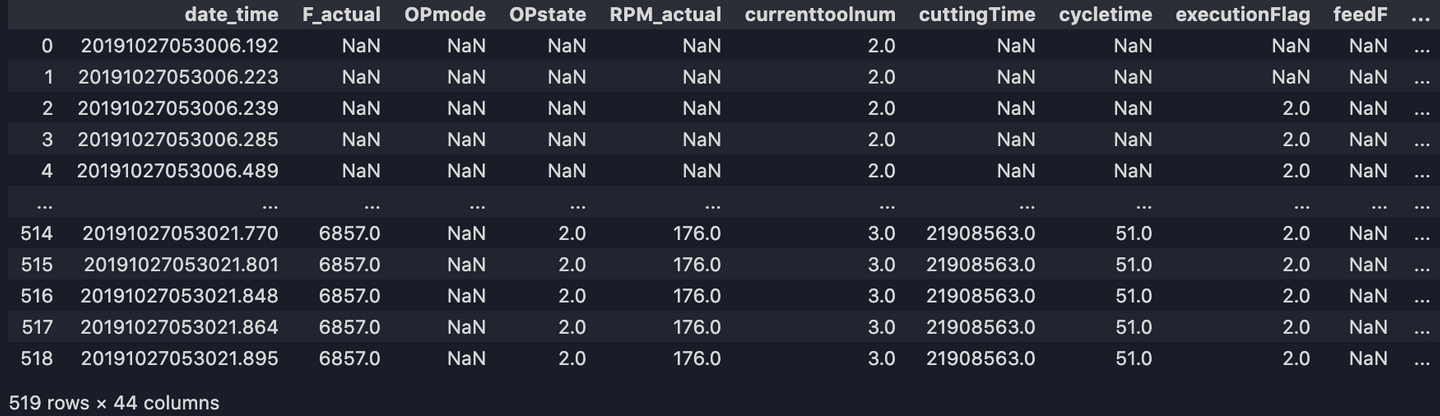
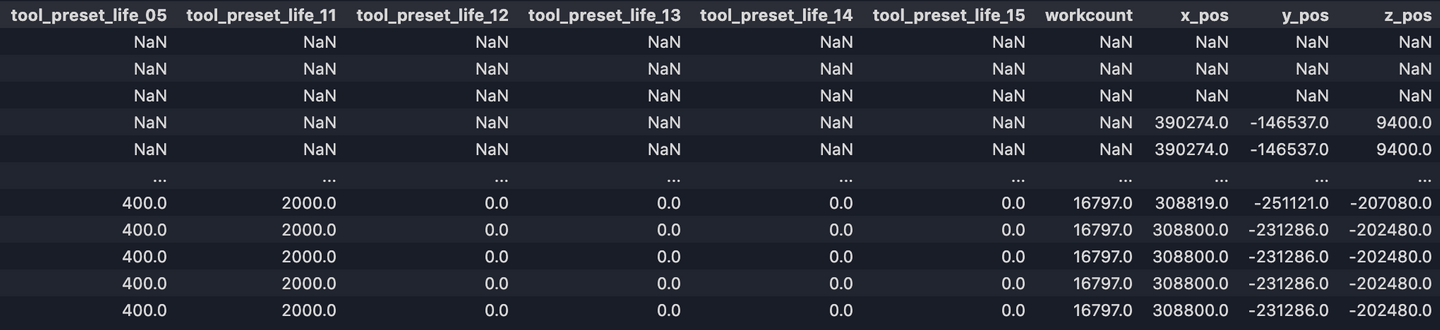
Now our output df.csv looks like:
9. Fill up missing values
Last step! Let’s fill up missing values with ffill(). ffill stands for ‘forward fill’ and that will propagate last valid observation forward.
df = df.ffill()
df.to_csv('output/df_new.csv')
Finally, we have our final output.
Now, with this clean dataset, we’re ready to do further analysis, process, or write to a data storage for API queries! If you are want to gather further information and are looking for a better understanding of data computing with python, take a look at my second blog on the subject.


Did this article start to give you some ideas? We’d love to work with you! Get in touch and let’s discover what we can do together.