Renewable Energy Leader
.jpg)
The context
Our client, a leading renewable energy organization with a longstanding leadership role in the global transition to net zero owns, operates, and develops a substantial portfolio, spanning hydro, solar, wind, energy storage, and more. Across Canada, it runs several dozen power plants (aka “sites”), all monitored by a dedicated team at their control centre. But even with their deep commitment to renewable power, climate change is reshaping Canada’s weather patterns, making it harder to predict and prepare for events that directly impact site operations.
Our client came to us with a vision for a solution that would alert their control centre team when weather or environmental thresholds at their sites were met. We saw the chance to push that idea further and transform a manual, reactive process into an automated, predictive dashboard powered by AI.
Project details
The challenge
Before this project, our client’s control centre didn’t have a centralized way to view environmental information relevant to their sites. A wide range of factors can impact operations from rainfall and snowfall to wind speeds and wildfire risk. For example, sudden heavy rainfall is critical for hydro since it can quickly raise water levels and strain dam infrastructure. For solar, dense smoke directly reduces energy generation efficiency. And for wind, extreme gusts can force turbines offline and risk structural damage.
During our early brainstorms with them, an idea for wildfire prediction emerged, and it quickly became the most exciting part of the project. We were challenged to tap into reliable, frequently updated environmental data and build a smart model that could predict where wildfires might head next. We required infrastructure to process large volumes of data quickly, strong visualization tools to make insights clear at a glance, and the flexibility for their team to configure thresholds and alerts that matched the realities of each site.

.jpg)
.jpg)
The task at hand
We kicked things off with an accelerated design phase that lasted just one week, as our client was clear on the information they wanted included. One of our designers stepped in to craft a simple and efficient user experience based on what we understood to best fit with their needs.
On the AI side, a dedicated team member reshaped an existing framework, drawing on a publicly available study that shows how NASA satellite fire detections, combined with modeling, can track wildfire history and predict its spread. Using the study’s physics-informed cWGAN method, trained on WRF–SFIRE simulations, we inferred wildfire arrival times from NASA VIIRS active-fire data, then adapted the method to our own stack with ONNX Runtime and Go. We complemented this with Environment Canada’s weather data, which powers the full range of alerts beyond wildfires, bringing predictive heatmaps and real-time notifications to the dashboard.
The web application itself was built using Go with the Gin web server to handle requests, PostgreSQL to store site configurations, users, and sessions, and Leaflet.js to provide the interactive mapping experience. To handle automation, we used Gocron for forecasts, predictions, and timezone-based email notifications, delivered through Mailgun.
.jpg)


The end result
The project was a relatively small-scope initiative with big impact, completed in just six weeks.
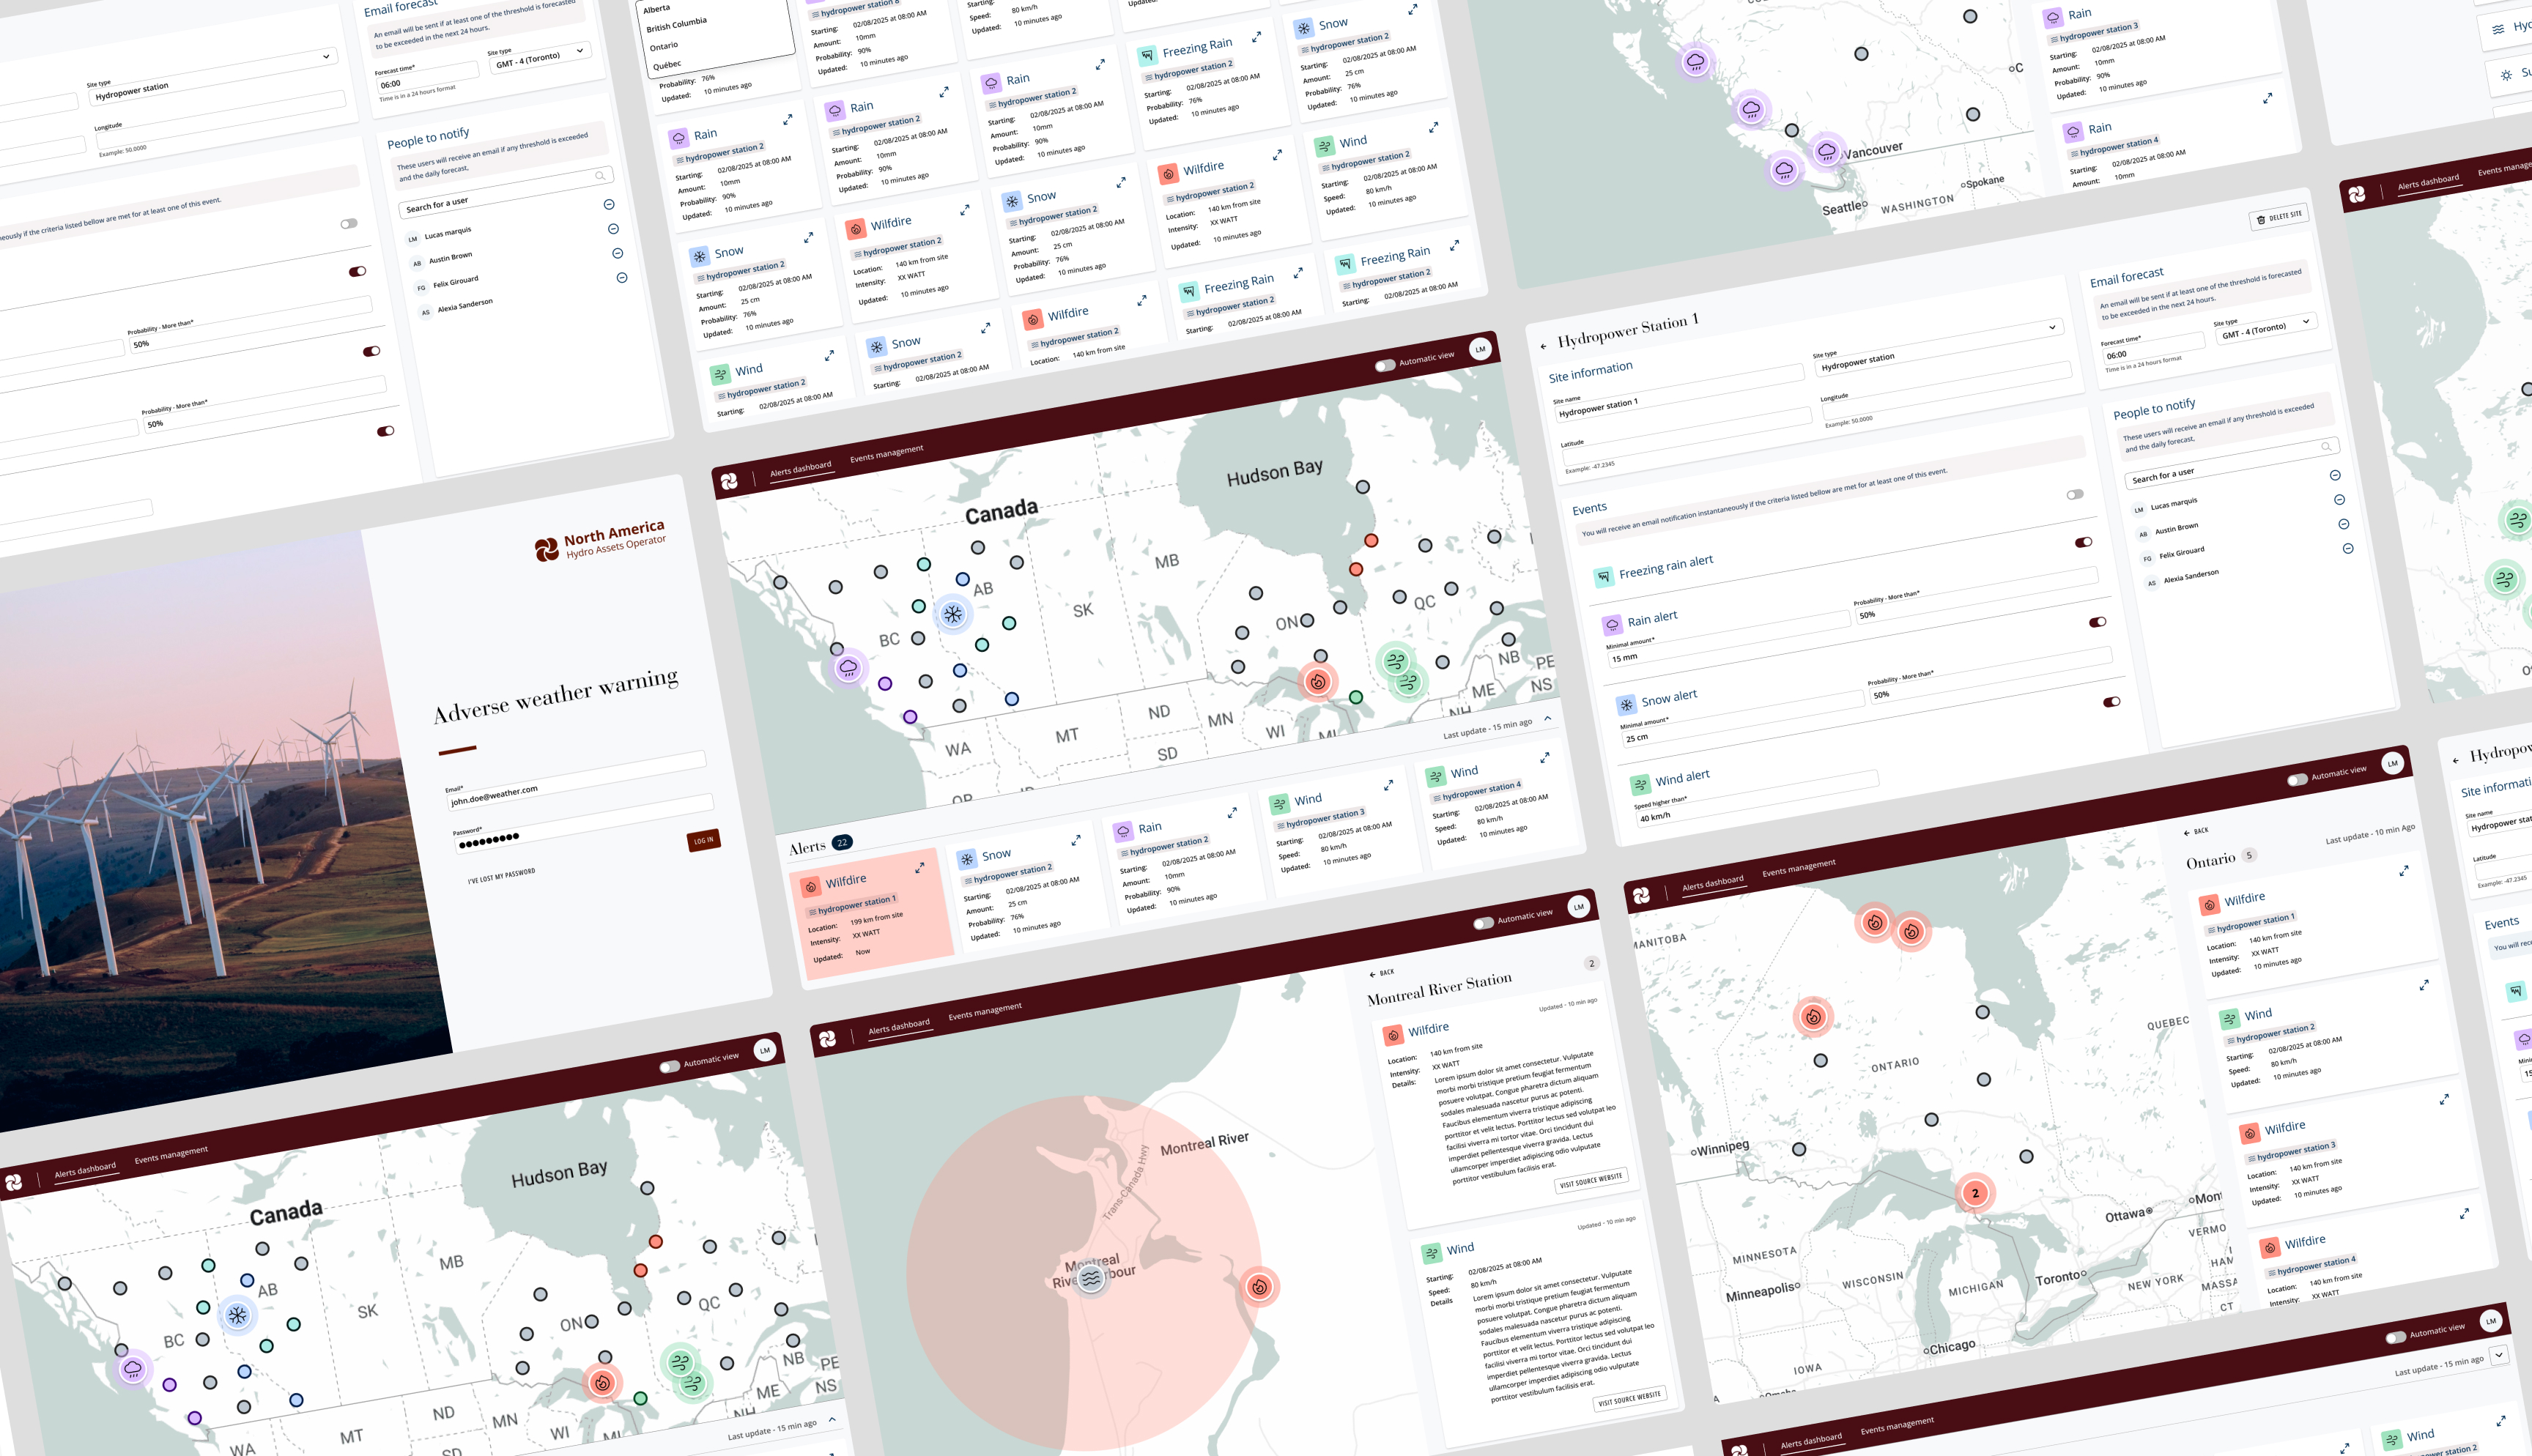
The dashboard itself is both functional and visually engaging. Built for flexibility, the control centre team can configure thresholds for conditions like heavy rainfall, freezing rain, snowfall (light, heavy, blizzards), wind speeds (moderate, strong, gusts, sustained high winds), and wildfire risk (dryness + wind + temperature). As thresholds are met, the dashboard tags conditions, scrolls through alerts with smooth transitions, zooms in and out on provinces where sites are located, and highlights the most critical information. Dynamic visualizations outline the shape of wildfires and forecast the direction they’re most likely to spread. In addition, visual layouts can be reordered, alerts can be sorted, and conditions can be filtered, making the tool adaptable as operations evolve.
At the control center, employees also receive automatic email alerts when thresholds are triggered. They can easily add recipients—like plant operators at specific sites—making sure the right people stay informed.

What’s next
This project was especially rewarding, and we’re proud of what we achieved together with this renewable energy client. With quick access to site-specific guidance, the dashboard is expected to translate into better preparation, faster response times, and smarter decisions. And as they grow their massive portfolio of hydro, solar, and wind assets, the platform is ready to scale.
If your business faces similar challenges, such as tracking complex data, connecting it across multiple sites, and applying AI to turn it into actionable insights, we’d love to help. Let’s build something powerful together.
Did this project give you some ideas? We’d love to work with you! Get in touch and let’s discover what we can do together.


Insights

-min.jpg)
-min.jpg)
.png)
-min.jpg)

We’re on a constant quest to broaden our horizons and spread wisdom. It’s all about pushing boundaries and elevating our game.